

What if one median price gives you the wrong impression of the Apple Valley CA housing market 2024? A figure can look straightforward, but its meaning depends on what was measured, when the data was collected, and which homes were included.
If you’ve seen different numbers across real estate sites, that uncertainty makes sense. Sources may use different reporting periods or definitions, and a market-wide median can’t describe every property type or neighborhood. This article explains how to read the main indicators behind Apple Valley’s 2024 market, what those figures can tell you, and what they can’t tell you about a decision today.
You’ll learn how to distinguish asking prices, sold prices, and time on market, and why the source and date matter. The goal isn’t to treat 2024 as a forecast. It’s to put that historical snapshot in context and recognize when a current, property-specific assessment is more useful. For guidance on how your home or search fits today, Adria Chamberlain offers local market insight and personalized home valuations or comparative market analyses.
Key Takeaways
- Read Apple Valley CA housing market 2024 figures as a dated snapshot, not a definitive measure or guide to today’s conditions.
- Check the source and reporting period before interpreting a trend. Don’t draw conclusions the data can’t support.
- Look beyond citywide figures. Property type and neighborhood affect how relevant a broad measure is to a specific home.
- Use historical patterns to frame useful questions as a buyer or seller, not to assume the same conditions apply now.
- For a present-day decision, compare current, relevant data with your property or search needs and consider personalized local guidance.
Apple Valley CA Housing Market 2024: What the Local Snapshot Can Tell You
This section looks back at historical conditions during 2024. It does not describe today’s market, and figures from that year should not be treated as current guidance. A housing market snapshot may include closed-sale prices, sales activity, available listings, and time on market. No single measure tells the whole story.
This guide covers residential housing in Apple Valley, California, during calendar year 2024. It does not represent other High Desert communities or current market conditions. For basic background on the town and its location, see Apple Valley, California.
Which housing indicators belong in a 2024 snapshot?
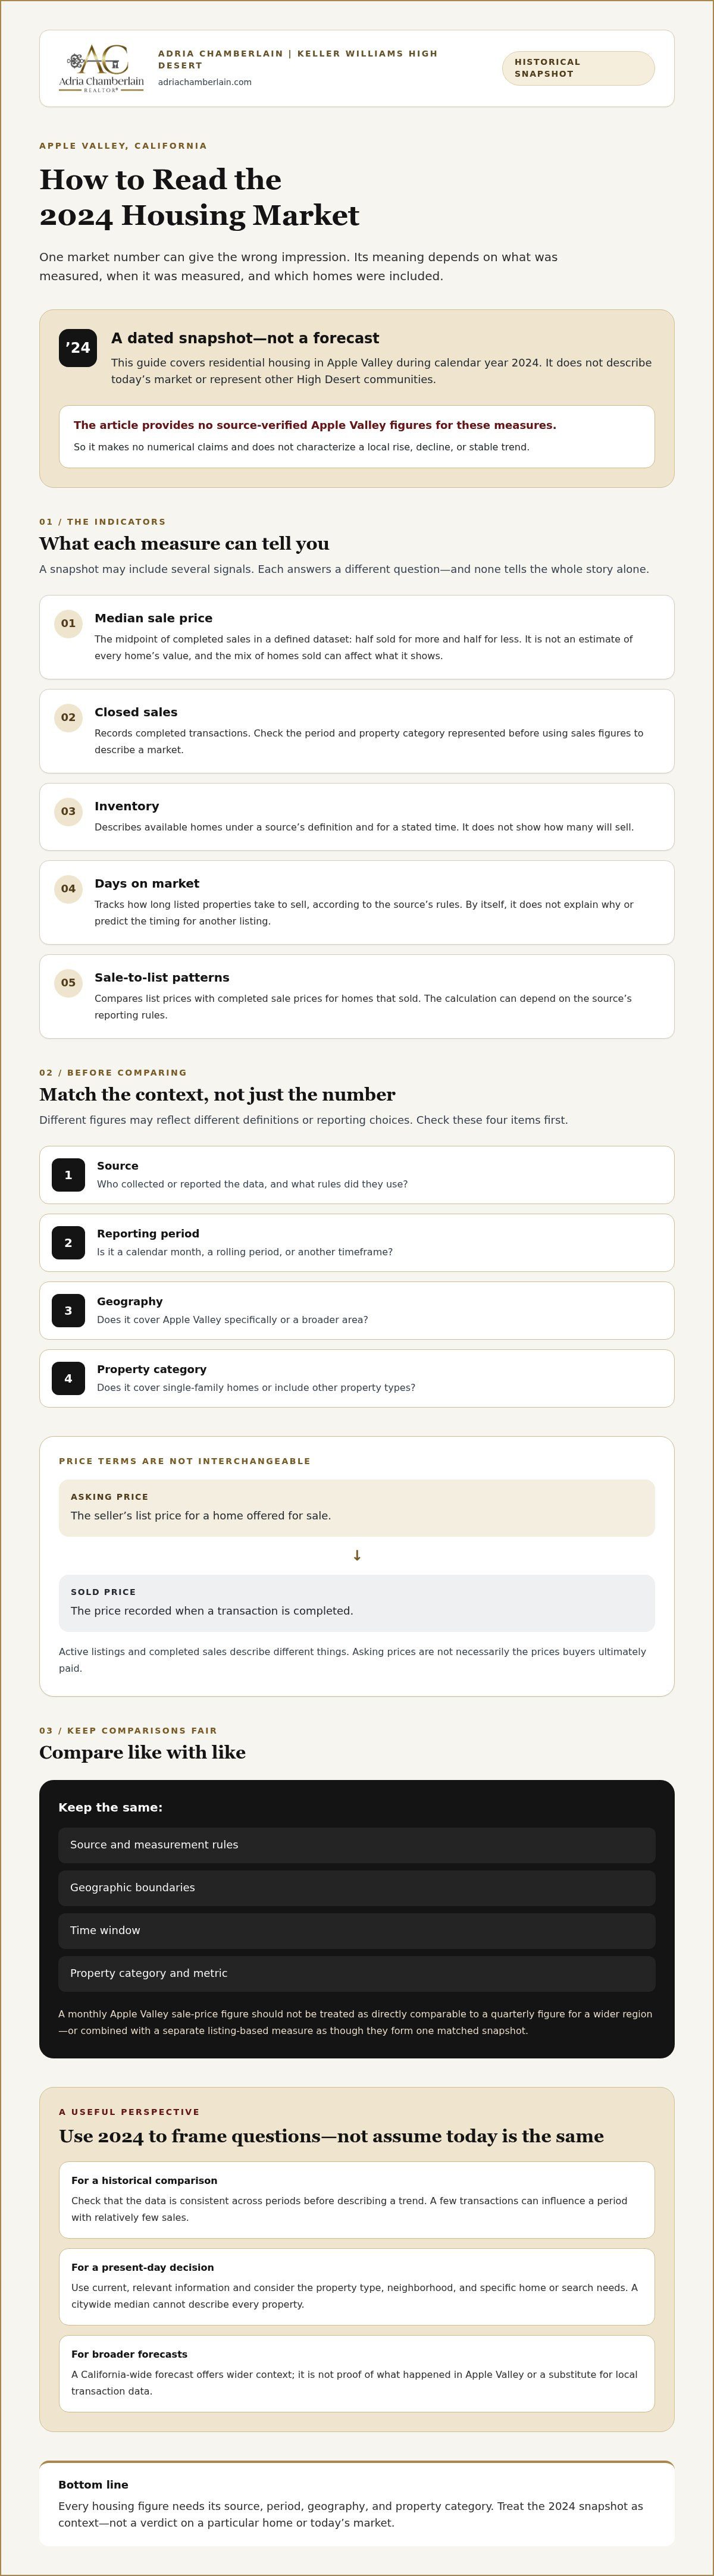
A useful local review may include median sale price, closed sales, inventory, days on market, and sale-to-list patterns. Before interpreting a figure, identify its source, reporting period, geographic boundary, and property category. Also check whether it describes completed sales or homes currently listed for sale.
This guide does not provide source-verified Apple Valley figures for these measures, so it does not make numerical claims or describe a local trend. When verified, a median sale price represents the midpoint of transactions in the selected dataset: half sold for more and half for less. It is not an estimate of every home’s value, and it does not show how a particular neighborhood or property type performed.
Why can Apple Valley market figures differ by source?
Two sites can show different results without either one necessarily being wrong. One may report a calendar month while another uses a rolling period. One may cover Apple Valley specifically, while another groups it with a broader area. A dataset may include only single-family homes, while another includes additional property types.
Check what each number measures before comparing it. Closed-sale data records completed transactions; active listings show homes offered for sale at a particular time. Asking prices reflect sellers’ list prices, not necessarily the prices buyers ultimately paid. Sale-to-list measures compare those two amounts for homes that sold, and the calculation may depend on the source’s reporting rules.
For a fair comparison, keep the geography, time window, property category, and metric consistent. Don’t combine one source’s monthly sale-price figure with another source’s year-end inventory count and describe them as a matched snapshot. This helps clarify what the Apple Valley CA housing market 2024 data can support and where questions remain unanswered.
How to Read Apple Valley Housing Trends Across 2024
A year-long trend is useful only when the underlying numbers are comparable. This guide does not include a source-verified monthly or quarterly series for Apple Valley prices, inventory, or days on market during 2024. Without consistent local data, it wouldn’t be responsible to describe a rise, decline, or stable pattern.
A California-wide forecast can offer broader context, but it isn’t a record of what happened in Apple Valley. The California Association of REALTORS® provides statewide outlook material in its 2025 California Housing Market Forecast. Treat forecasts as expectations for the market area they describe, not as proof of local outcomes or a substitute for Apple Valley transaction data.
What do price, inventory, and days on market measure?
Median sale price is the midpoint of completed sales in a specified dataset and period. It doesn’t establish the value of every home or explain whether the mix of homes sold changed. Inventory describes available homes under a source’s definition and at a stated point or period; it doesn’t show how many will sell. Days on market tracks how long listed properties take to sell according to the source’s rules. On its own, it doesn’t explain why the timing occurred or predict what will happen to another listing.
For each measure, note the source, geography, dates, and property type. Compare like with like: a monthly median for Apple Valley single-family sales should not be set against a quarterly figure for a wider region or a listing-based measure. Asking prices show what sellers are seeking, not the completed prices buyers paid.
How can readers compare months without overreading the data?
First confirm that both periods use the same source, boundaries, property categories, and metric. Then check how many transactions support each period. When a local period includes relatively few sales, a handful of higher- or lower-priced transactions can shift the median. A month-to-month change alone may not establish a lasting market direction.
Beside every figure or chart, include a source-and-period note with the publisher, Apple Valley coverage, property category, and exact month or quarter. This guide doesn’t provide a verified monthly or quarterly comparison for 2024, so specific figures are omitted rather than inferred. For a current, property-specific perspective, readers can explore Adria’s local real estate guidance and discuss how today’s evidence relates to their plans.
Apple Valley’s Property Mix: Why One Market Number Is Not the Whole Story
A citywide figure can be a useful starting point, but it may hide differences among homes. Property type, size, condition, location, and features all affect how relevant a broad comparison is to a specific property. Without a dataset that separates those categories, it isn’t possible to say how one type or neighborhood performed relative to another in the Apple Valley CA housing market 2024.
Data USA reports a 2024 median property value of $407,400 for Apple Valley. That is a property-value measure, not a median sale price for homes sold during the year. Don’t read it as the expected value of an individual home or compare it directly with listing prices or a sales dataset without checking how each source defines its measure.
How can property type affect a market comparison?
A citywide median blends the properties included in its underlying data. If a source doesn’t break out single-family homes and other categories separately, the figure can’t show how those groups compare. Even within one category, two homes may differ in size, condition, location, or features. A broad market pattern doesn’t determine either home’s value.
Before drawing a conclusion, check whether the source provides separate figures for the property type you care about. If it doesn’t, treat the number as general context rather than a direct comparison for a particular home.
What local context should readers check before drawing conclusions?
Confirm that the data covers Apple Valley itself, not a wider High Desert area, and note the time period and property categories included. If the source provides a transaction count or sample size, review that as well. Neighborhood-level claims need appropriately detailed evidence. A townwide figure alone can’t establish that one neighborhood performed differently from another.
| Metric and source | What it can show | What it cannot show |
|---|---|---|
| Median property value, Data USA, Apple Valley, 2024: Data USA’s Apple Valley property-value data | A reported midpoint property-value measure for the stated geography and year. | It does not, by itself, describe completed sale prices, current asking prices, individual home values, or differences between property types and neighborhoods. |
| Sale price, inventory, days on market, and sale-to-list patterns | These can help describe transactions or listings when a dated, local source reports them. | This guide does not provide verified Apple Valley 2024 figures for these measures, so they cannot support a property-segment comparison here. |
Use the Data USA figure for the specific measure and period it reports. For a home-specific assessment, relevant comparisons need to account for the property itself and use current, appropriately matched local evidence.
What Apple Valley’s 2024 Housing Market History Means for Buyers and Sellers
Historical market information can help you ask better questions, but it can’t guarantee what a home will sell for or what conditions you’ll find today. The Apple Valley CA housing market 2024 is a record of a past period, not a prediction or current valuation. Since the local figures presented here don’t establish a complete 2024 trend, use them as context and confirm any decision with current, relevant information.
How should buyers use a historical market snapshot?
If you’re considering a home in Apple Valley, use historical data as a starting point for research, not as a substitute for it. Check current listings and recent comparable closed sales, meaning homes similar in location and features that have actually sold. Ask whether the comparisons reflect the property type and area you’re considering. A buyer’s agent can help put those details in context, while a lender can discuss financing questions based on your individual circumstances.
For a practical starting point, read the published first-time home buyer guide for Apple Valley buyers. It can help you prepare questions about your search and the steps involved without treating historical market patterns as a promise about future prices or availability.
How should sellers use 2024 market information?
A citywide figure from 2024 can’t tell you what your home is worth now. Current comparable sales, the property’s condition, and its specific features are more relevant to a present-day pricing discussion. A broad median may include homes unlike yours, and market conditions may have changed since the data was collected.
The published Victorville home valuation guide may offer useful background on valuation concepts, but Victorville is a different city. Its data or examples shouldn’t be treated as Apple Valley evidence. For a home-specific assessment, a comparative market analysis (CMA) considers relevant local sales and property details. It can inform a conversation, but it can’t guarantee a sale price, timeline, or outcome.
Buying or selling also involves personal financial circumstances. Consider your own needs and consult qualified professionals for financial, tax, or legal questions. To discuss how current Apple Valley information relates to your home or search, request personalized real estate guidance from Adria.
How to Put the Apple Valley CA Housing Market 2024 in Perspective Today
The Apple Valley CA housing market 2024 can help explain a past period, but it can’t answer every question about a home or purchase today. Before comparing a historical figure with a current report, check what each number measures and whether the figures belong side by side.
A practical checklist for comparing 2024 with a current report
- Check the source. Identify who published the information and whether the figure comes from completed transactions, current listings, or another measure.
- Confirm the geography. Make sure both reports cover Apple Valley rather than comparing Apple Valley data with a broader High Desert or countywide figure.
- Match the property category. A report on single-family homes may not be comparable with one that includes other property types.
- Compare equivalent periods and metrics. A full-year median sale price and a current asking price describe different things. Note the dates and definitions instead of treating them as interchangeable.
- Trace each number. Keep figures only when the source and reporting timeframe are clear. If those details are missing, leave the number out rather than filling in the gaps.
This approach keeps historical facts separate from present-day conditions. This guide doesn’t include current 2026 market figures because a specific source and reporting period haven’t been established here. A 2024 figure shouldn’t be presented as current, and a broad statewide or regional trend shouldn’t be used to imply what’s happening in Apple Valley.
When is personalized local guidance useful?
A general market report may be enough to understand broad context. If your question is about a particular home, a more focused review can help. A comparative market analysis (CMA) considers relevant comparable sales alongside details of the property. Recent sales and property-specific information can make the discussion more useful than relying on a citywide historical measure alone. A CMA is an informed assessment, not a guarantee of value, sale price, or timing.
Adria Chamberlain offers home valuations and comparative market analyses for people who want to discuss how their property fits current local conditions. Whether you’re weighing a move, preparing to sell, or beginning a search, talk with Adria about your Apple Valley real estate questions.
Use Local Context to Plan Your Next Move
The Apple Valley CA housing market 2024 is best read as historical context, not a forecast or present-day home valuation. The source, reporting period, geography, and property type all shape what a market figure can tell you. A citywide median can’t capture the details that make one home different from another.
For buyers, 2024 history can help frame questions, but current listings and comparable closed sales are more relevant to a present search. For sellers, a current assessment should reflect recent local sales and the specific property, not rely on a past citywide number.
Adria Chamberlain, a licensed REALTOR® affiliated with Keller Williams High Desert, provides personalized guidance and home valuation or comparative market analysis services. She has served High Desert and Inland Empire communities since 2017. Her local coverage includes Apple Valley, Hesperia, Victorville, Adelanto, Oak Hills, Helendale, Barstow, Phelan, Pinon Hills, and Lucerne Valley. Contact Adria for personalized Apple Valley real estate guidance.
Frequently Asked Questions
What was the median home price in Apple Valley, CA, in 2024?
A verified median sale price for Apple Valley homes in 2024 isn’t provided in this guide. Data USA reports a median property value of $407,400 for Apple Valley in 2024, but property value is not the same measure as the midpoint price of homes sold during that year. Check the source’s definition before comparing it with sale-price figures from real estate websites.
Did Apple Valley home prices go up or down in 2024?
The verified information presented here doesn’t establish whether Apple Valley home sale prices rose or fell across 2024. To answer that accurately, you’d need a consistent local series, such as monthly median sale prices from the same source, covering the same property types and geography. A single annual property-value measure can’t confirm the direction of sale prices throughout the year or explain what caused a change.
Was Apple Valley, CA, a buyer’s or seller’s market in 2024?
The information presented here isn’t enough to classify Apple Valley’s 2024 market as a buyer’s or seller’s market. That assessment typically depends on measures such as active listings, completed sales, and how quickly homes sold, all tied to a clear period and location. Without comparable Apple Valley-specific data for 2024, a confident label could oversimplify conditions or confuse them with a broader regional market.
How long did homes take to sell in Apple Valley in 2024?
A verified 2024 days-on-market figure for Apple Valley isn’t provided here. Days on market generally measures how long a listed home takes to sell, but sources may calculate it differently or report different periods and property types. For a reliable comparison, check the source, date range, and geography. Don’t substitute a current figure or a broader High Desert average for 2024 local data.
Is 2024 housing market data still useful to Apple Valley buyers and sellers in 2026?
Yes, 2024 data can provide historical context, but it shouldn’t stand in for current research in 2026. Use it to understand the period or develop questions, then compare it with current information using matching geography, property categories, and measures. For example, compare closed sales with closed sales, not with asking prices. Past patterns don’t guarantee today’s prices, market conditions, or results for a particular property.
How can I find current comparable home sales in Apple Valley, CA?
Look for recently closed sales in Apple Valley, then compare homes with similar property types and relevant features, such as size, condition, and location. Check the sale dates and confirm the data covers Apple Valley rather than a wider High Desert area. A comparative market analysis can help organize relevant local sales around a specific property. Adria Chamberlain offers home valuations and comparative market analyses; these are assessments, not guaranteed sale prices.
Are Apple Valley housing market statistics different from broader High Desert data?
They can be, because reports may cover different boundaries, time periods, or property categories. A figure for Apple Valley shouldn’t automatically be treated as representative of Victorville, Hesperia, Adelanto, Oak Hills, Helendale, Barstow, Phelan, Pinon Hills, or Lucerne Valley. Before comparing statistics, check the location covered, dates, and property types included. A regional figure can offer context, but it doesn’t establish conditions in Apple Valley specifically.


